Air quality monitoring data:
White Bay Cruise Terminal
Real-time air quality data for White Bay Cruise Terminal, Sydney
* As of March 2022, air quality monitoring at White Bay has temporarily paused whilst changes to the monitoring instrumentation are implemented. Port Authority is seeking input from relevant agencies regarding the future requirements for monitoring. When the system resumes operation, further information will be made available here.
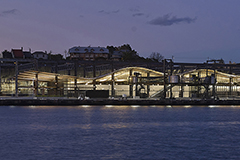
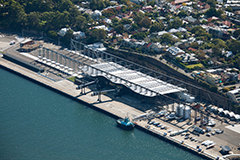
Port Authority of New South Wales, in consultation with the EPA, has installed an air quality monitoring station at the corner of Grafton and Adolphus streets, Balmain to monitor the ambient air quality in the immediate vicinity of the White Bay Cruise Terminal.
The station monitors sulphur dioxide (SO2), particulate matter less than 2.5 microns diameter (PM2.5) and meteorological parameters including wind speed and direction.
The near-real-time air quality monitoring data, as well as information showing the presence of commercial shipping at the berths of Glebe Island and White Bay, is shown below. The monitoring is undertaken by Pacific Environment Limited. Monthly analysis reports are prepared and made public on Port Authority's website.
Disclaimer: The data used in the compilation of this page have undergone only preliminary quality assurance checks by ERM. These data may require modification during final stages of validation as a result of calibration changes, power failures, instrument failures etc.Notes:
To view the EnviroSuite page directly, go to: https://es2.envirosuite.com/monitoring/pansw/sydney
SO2 data provided as a rolling 1 hour average
PM2.5 data provided as a rolling 24 hour average
|
Pollutant |
Averaging Period |
Maximum (ambient) Concentration in μg/m3 |
|
SO2 |
10 minute |
712* |
|
1 hour |
570* |
|
|
24 hour |
228* |
|
|
PM2.5 |
1 day |
25* |
* source NSW EPA
Note that there is no advisory goal for PM2.5 Hourly and this data is presented for information purposes only.
Influence Arc - approximates the area that is influencing the monitoring station based on meteorological conditions (i.e. upwind of the monitoring station)
Historical data can be accessed by using the slider at the bottom of the image and selecting the date
Additional data information can be obtained by clicking on the hexagon
Data is updated every 5 minutes
Shipping berths: GLB1 = Glebe Island 1; WHT5 = White Bay 5 (White Bay Cruise Terminal); etc
Vessel Identifiers consist of the code for the type of vessel (see below) and the first 10 characters of the vessel name (e.g. "Pacific Pe" for Pacific Pearl):
P=Passenger vessel
B=Bunker vessel (refuelling vessel)
C=Cargo vessel (dry bulk and bulk liquids)
N=Navy vessel


